
It feels like the tug of war between reality and perception warrants some myth-busting. More and more, we observe that many hard facts around general consumer debt levels and consumer credit are presented without context and under headlines that intimate impending doom and gloom. What’s the saying – Fear Sells?
In this commentary, we dive deeper into a series of facts and offer context around each. In our view, after considering the data and context, household credit looks pretty good. Data and analyses presented herein are based on data from the New York Fed (here) and from the Fed’s FRED website.
Fact: U.S. household debt reached an all-time high of $16 trillion as of June 30.
Context: U.S. household debt is a nominal metric that usually sets a new high at each quarterly reading given (a) underlying nominal economic growth and (b) inflation. Outside of abnormal crisis-induced lulls (e.g., post great recession period 2008 – 2013), household debt levels tend to rise steadily at an annual clip of around 4.2%, measured since 2003. Over the same period, nominal GDP has grown at a 4.2% annual rate. Makes sense.
Fact: Household debt grew $300 billion quarter-on-quarter (8%), a rate of 5.6% year-on-year.
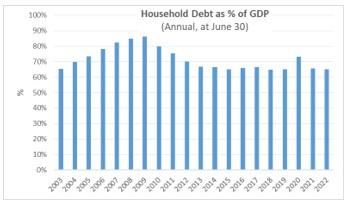
Context: Annualized nominal GDP grew 9.2% from the end of June 2021 through June 2022. When viewed relative to nominal GDP (see chart below), household debt has actually been stable at about 65% of GDP since 2013. The slight bump in 2020 is due to the sharp GDP drop during Covid.
Fact: Most of this $16 trillion debt load is in residential mortgages: $11.4 trillion (or 70%) are secured by homes. Adding HELOCs to the mix increases the secured debt load to $11.7 trillion (>72%).
Context: Of the $300 billion quarterly growth in household debt, $210 billion (about 70%) were in mortgage and HELOC balances. Mortgage underwriting since the great financial crisis has been laudable. Over 90% of household mortgage balances are held by prime borrowers (FICO 660+), and around 70% by super-prime borrowers (FICO 760+). In 2008, the super-prime share of outstanding balances was under 50%. As of June 30, subprime (FICO below 620) accounted for around 5% of mortgage balances, the lowest level since the late 1990s and significantly lower than the approximately 15% peak seen in the aftermath of 2008.
Note that from 2003 to 2022, residential mortgage balances increased about 4.3% per year, in line with annual national home price appreciation of 4.4% per year (based on Case-Shiller). Both were slightly ahead of the 4.2% growth in total household debt.
Moving to consumer credit, that is, household debt excluding mortgages and HELOCs:
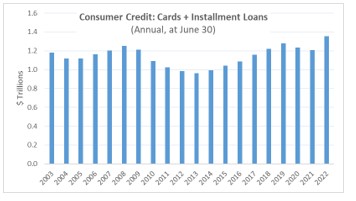
Fact: This category, with $4.4 trillion in balances, includes auto loans, student loans, credit card debt, and personal installment loans. We focus on the last two. On an absolute basis, the subset of credit card and personal installment loan balances reached $1.36 trillion, a new high (see chart below).
Context: Growth in this subset category was at an annualized rate of 2% over the last three years (as of June 30), which is less than half of the approximate 5% annual growth trend from 2013 to 2019.
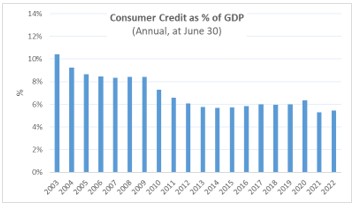
Per the chart below, the subset category’s outstanding balance relative to nominal GDP has been declining from the 10.4% level of 2003. Over the past 10 years, the metric has ranged from a high of 6% in 2012 to 5.5% in 2022.
A few more points: Over 70% of the subset category’s balances are held by prime borrowers (FICO 660+), a level that been largely stable over the past 20 years. Over 50% of balances are held by borrowers with FICO scores above 720.
Fact: Credit delinquency levels are reverting to historical averages as the economy normalizes.
Context: Delinquency rates in the twelve months following mid-2020 were at historic lows given distortion caused by pandemic stimulus and consumer behavior. Assuming these low levels would persist forever would have been both unrealistic and naïve. Recent data shows that credit card delinquencies, while rising, are still below pre-pandemic averages. When evaluating the data along income segments, delinquencies are still meaningfully lower.
Investment managers specializing in private loans should anticipate these trends and adjust portfolio management accordingly, primarily through higher reserve rates against higher levels of future loss. At HCG, we started down this path in the middle of 2021. Fact.